My Notes on NumPy
I use this notebook to build my muscle memory. These are examples from Python Data Science Handbook by Jake VanderPlas.
import numpy as np
np.random.seed(0) # seed for reproducibility
x1 = np.random.randint(10, size=6)
x2 = np.random.randint(10, size=(3,4))
x3 = np.random.randint(10, size=(3,4,5))
print('array x1:', x1)
print('array x2:', x2)
print('array x3:', x3)
print('x3 type:', x3.dtype)
array x1: [5 0 3 3 7 9]
array x2: [[3 5 2 4]
 [7 6 8 8]
 [1 6 7 7]]
array x3: [[[8 1 5 9 8]
  [9 4 3 0 3]
  [5 0 2 3 8]
  [1 3 3 3 7]]

 [[0 1 9 9 0]
  [4 7 3 2 7]
  [2 0 0 4 5]
  [5 6 8 4 1]]

 [[4 9 8 1 1]
  [7 9 9 3 6]
  [7 2 0 3 5]
  [9 4 4 6 4]]]
x3 type: int64
x2_copy = x2[1:2, 1:3].copy()
print(x2_copy)
[[6 8]]
A1 = np.array([1, 2, 3])
A2 = np.array([4, 5, 6])
A3 = np.array([12, 25, 57])
A4 = np.concatenate([A1, A2, A3])
print(A4)
[ 1 2 3 4 5 6 12 25 57]
A5 = A4.reshape(3, 3)
print(A5)
[[ 1  2  3]
 [ 4  5  6]
 [12 25 57]]
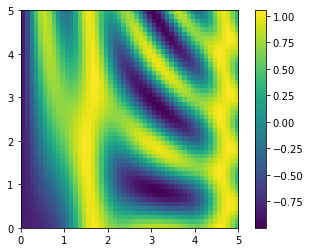
#Broadcasting--plotting a two-dimensional function
import numpy as np
x = np.linspace(0, 5, 50)
y = np.linspace(0, 5, 50)[:, np.newaxis]
z = np.sin(x) ** 10 + np.cos(10 + y * x) * np.cos(x)
print(x, y, z)
%matplotlib inline
import matplotlib.pyplot as plt
plt.imshow(z, origin='lower', extent=[0, 5, 0, 5], cmap='viridis')
plt.colorbar();
[0.         0.10204082 0.20408163 0.30612245 0.40816327 0.51020408
 0.6122449  0.71428571 0.81632653 0.91836735 1.02040816 1.12244898
 1.2244898  1.32653061 1.42857143 1.53061224 1.63265306 1.73469388
 1.83673469 1.93877551 2.04081633 2.14285714 2.24489796 2.34693878
 2.44897959 2.55102041 2.65306122 2.75510204 2.85714286 2.95918367
 3.06122449 3.16326531 3.26530612 3.36734694 3.46938776 3.57142857
 3.67346939 3.7755102  3.87755102 3.97959184 4.08163265 4.18367347
 4.28571429 4.3877551  4.48979592 4.59183673 4.69387755 4.79591837
 4.89795918 5.        ] [[0.        ]
 [0.10204082]
 [0.20408163]
 [0.30612245]
 [0.40816327]
 [0.51020408]
 [0.6122449 ]
 [0.71428571]
 [0.81632653]
 [0.91836735]
 [1.02040816]
 [1.12244898]
 [1.2244898 ]
 [1.32653061]
 [1.42857143]
 [1.53061224]
 [1.63265306]
 [1.73469388]
 [1.83673469]
 [1.93877551]
 [2.04081633]
 [2.14285714]
 [2.24489796]
 [2.34693878]
 [2.44897959]
 [2.55102041]
 [2.65306122]
 [2.75510204]
 [2.85714286]
 [2.95918367]
 [3.06122449]
 [3.16326531]
 [3.26530612]
 [3.36734694]
 [3.46938776]
 [3.57142857]
 [3.67346939]
 [3.7755102 ]
 [3.87755102]
 [3.97959184]
 [4.08163265]
 [4.18367347]
 [4.28571429]
 [4.3877551 ]
 [4.48979592]
 [4.59183673]
 [4.69387755]
 [4.79591837]
 [4.89795918]
 [5.        ]] [[-0.83907153 -0.83470697 -0.8216586  ...  0.8956708   0.68617261
   0.41940746]
 [-0.83907153 -0.82902677 -0.8103873  ...  0.92522407  0.75321348
   0.52508175]
 [-0.83907153 -0.82325668 -0.79876457 ...  0.96427357  0.84172689
   0.66446403]
 ...
 [-0.83907153 -0.48233077 -0.01646558 ...  0.96449925  0.75196531
   0.41982581]
 [-0.83907153 -0.47324558  0.00392612 ...  0.92542163  0.68540362
   0.37440839]
 [-0.83907153 -0.46410908  0.02431613 ...  0.89579384  0.65690314
   0.40107702]]
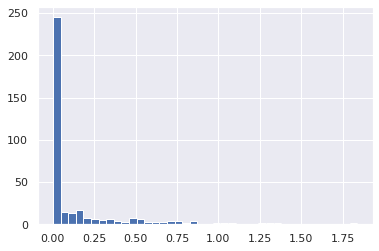
Counting rainy days
import numpy as np
import pandas as pd

rainfall = pd.read_csv('./Seattle2014.csv')['PRCP'].values
inches = rainfall / 254

print(inches.shape)

print(np.sum(inches > 0.5))

print('Number days without rain:      ', np.sum(inches == 0))
print('Number days with rain:         ', np.sum(inches != 0))
print('Days with more than 0.5 inches:', np.sum(inches > 0.5))
print('Rainy days with < 0.1 inches:  ', np.sum((inches > 0) & (inches < 0.1)))

%matplotlib inline
import matplotlib.pyplot as plt
import seaborn; seaborn.set()
plt.hist(inches, 40);
(365,)
37
Number days without rain:       215
Number days with rain:          150
Days with more than 0.5 inches: 37
Rainy days with < 0.1 inches:   46